 Overview of Survey Design
Survey participants and methods
A total of eleven waves of surveys were conducted between 1987 and 2024.
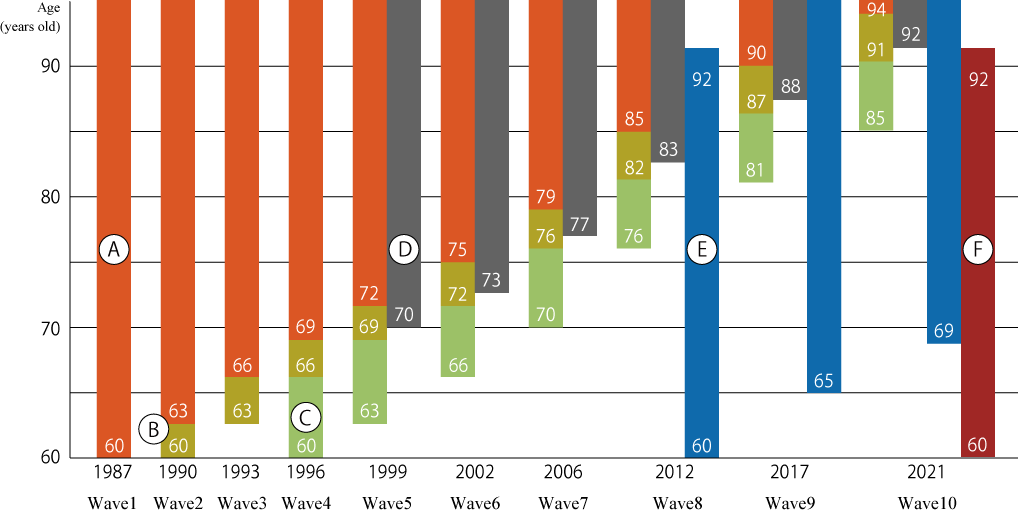
All participants newly added to the survey were randomly selected throughout Japan using a technique called two-stage stratified random sampling, although the year they were first added varied depending on the participant (as shown in Fig. 1). Note
(Note) Regions were stratified by a combination of regional block (Hokkaido, Tohoku, Kanto, etc.) and population, and the number of persons (sample size) selected from each stratum was determined based on the population of the target ages in that stratum. The procedure for extracting samples involved first selecting 192 survey locations throughout the country, then selecting individuals of the relevant ages from each location using the Basic Resident Register.
Participants who joined the survey for the first time were generally asked to participate in each subsequent survey, unless they died or declined to continue participating. Whether they actually participate is, of course, left to the individual's discretion. By the 11th survey, 7,892 individuals had participated at least once.
Central Research Services, Inc. conducted visit interviews from September to December of each year of the survey. The surveys were conducted as interviews of the participants themselves in principle. Beginning from the second wave, however, proxies such as family members were interviewed (for certain items) only if the participant was unable to respond for a reason such as serious illness.
The 10th wave of the survey was conducted in 2021 during the COVID-19 pandemic. A home-visit survey was conducted for the E and F participants of Fig. 1, while a mail survey was done for the A to D participants. Regarding the home-visit survey, the method of leave-behind questionnaire together with face-to-face interviews was used to shorten the interview length.
Home-visit surveys resumed for all participants across Groups A to F in the 11th wave of the survey in 2024. Participants in Groups A to D completed face-to-face interviews only, while those in Groups E and F also received a leave-behind questionnaire in addition to the face-to-face interviews.
The following describes the participants of each survey in somewhat greater detail.
[Birth year of the respondents]
A: 1893-1927, B: 1927-1930, C: 1930-1936, D: 1898-1929, E: 1919-1952, F: 1928-1961
In the 1st wave (1987), responses were obtained from 2,200 individuals aged 60 years or older throughout Japan (response rate, 67.2%; A of Fig. 1). Follow-up surveys were subsequently conducted every 3 years. Individuals aged 60-62 years and those aged 60-65 years were newly selected at random and supplemented to the panel in the 2nd (1990, B of Fig. 1) and 4th (1996, C of Fig. 1) waves, respectively.
In the 2nd and 4th waves, the number of newly selected individuals (sample size) was specified (2nd wave: 580, 4th wave: 1,210) so that the selection probability for an age group was roughly equal to its previous selection probability for an older age group. This was done so that the data analyzed were an unbiased reflection of individuals aged 60 years or older throughout Japan.
By the 4th wave, 3,580 individuals had participated (including proxies) and were asked to be participants in subsequent follow-up surveys.
In the 5th wave conducted in 1999, 2,000 new individuals aged 70 years or older were randomly selected (D of Fig. 1), while continuing follow-up of the A to C participants who had cooperated through the 4th wave. Individuals aged 70 years or older were added because the issues of the older old were a focus of the survey (→ see About the Project). Of the 2,000 new individuals, 1,635 who responded were added to the follow-up panel.
The 6th wave (2002) and 7th wave (2006) continued the follow-up of the A to D participants, without supplementing new samples.
In the 8th wave (2012), 2,500 individuals aged 60-92 years (E of Fig. 1) were randomly selected, while continuing the follow-up of the A to D participants. Of the new E participants who were respondents in the 8th wave (n=1,450), proxy participants and those who did not consent to subsequent participation were excluded from follow-up, and 1,257 remained as follow-up panel. The 9th wave (2017) continued follow-up of the A to E participants, without supplementing new samples.
The participants in Groups A to D received a short questionnaire with limited items, such as health status, instead of home visiting, and 443 (61%) of the 730 participants returned the questionnaire, including proxy responses. The participants who commenced participation in the eighth wave (E of Figure 1), as well as 2,700 newly selected individuals aged 60-92 years (F of Figure 1), were asked to participate in the home-visit survey, which included a face-to-face interview and a leave-behind questionnaire. Of the 1,227 individuals in the new Sample F who responded to the face-to-face interview in the 10th survey—either personally or through a proxy—908 agreed to continue participating and will be included in future follow-up surveys.
No new participants were recruited for the 11th wave. Instead, a follow-up survey was conducted with participants from Groups A through F. Home-visit interviews resumed for Groups A through D, who had completed a mail survey in the 10th wave. Only face-to-face interviews covering basic questions were conducted for participants who had been involved since the fifth wave (Groups A through D). Consistent with the approach used in the 10th survey, a leave-behind questionnaire with additional questions was also administered alongside the face-to-face interview for those who joined in the eighth or 10th wave (Groups E and F). Of the 1,828 eligible participants—excluding those known to have died or who had declined to participate—1,329 (73%) responded, either personally or through a proxy.
Number of respondents and response rate for interviews
The number of respondents (including proxy respondents) for each wave ranged from 2,000 to 4,000 through the eighth wave, but dropped below 2,000 for the first time in the ninth wave. The decrease occurred because death rates increased with age. As of the 11th survey (2024), deaths had been confirmed for 2,845 of the 3,580 followed participants in Groups A through C, 1,374 of 1,635 in Group D, 308 of 1,257 in Group E, and 60 of 956 in Group F (see Figure 1)
The response rate was 67% in the first wave (not including proxy response for the first wave), approximately 85% in the second to sixth waves, approximately 75% in the seventh and ninth waves, 67% in the eighth wave, and 54% in the tenth wave. However, it should be noted that comparing the response rates across waves is difficult because the presence or absence and proportion of newly added participants and the ages of the participants varied.
The response rate for the newly added sample is getting worse in recent surveys, partly due to the increasing privacy consciousness. It was 59% for the newly added E participants (Fig. 1) in the eighth wave and 46% for the F participants in the tenth wave, showing a greater decline than before. In particular, the tenth wave survey conducted in October to December in 2021 showed a larger regional difference in the response rate compared with the previous waves, suggesting a possibility of the influence of the COVID-19 pandemic. Meanwhile, the response rate for the follow-up participants who had experienced the survey(s) before exceeded 75% even in the eighth and tenth waves.
For more information, please see Table 1.
Survey content
The questions asked in the interview surveys of the participants are broad in scope. They comprise questions about physical and mental health, family, relationships with friends and neighbors, work and social participation, lifestyle, use of medical/health and welfare services, and economic conditions. Although many of the questions concern the status of the participant's health and life, there are also questions about their views, such as how they feel about their family.
Moreover, most of the questions are asked repeatedly in every survey or periodically (once every few surveys). On the other hand, there have also been questions that were asked only in certain surveys in order to respond to the social conditions and research trends present at that time.
Regarding physical condition, in addition to participants' self-reports (responses to questions), the interviewers obtained objective measures of body and physical performance, including height, weight, walking speed, and grip strength. The measurements were first taken in the eighth wave survey and continued in the ninth. These measurements were suspended in the 10th wave due to the COVID-19 pandemic but resumed in the 11th wave.
◎ Details on the methods used in the eighth and later waves are provided in the following study report (in Japanese):
Longitudinal study of the health and lives of older adults: Wave 8 survey (2012) research report (March 2015), Tokyo Metropolitan Institute of Gerontology
- Section 1: Project summary and the participants and methods of the eighth survey (pp. 1-20)
pdf version download![]() (530KB)
(530KB)
Longitudinal study of the health and lives of older adults: Wave 9 survey (2017) research report (January 2020), Tokyo Metropolitan Institute of Gerontology
- Section 1 of Part 1: The participants and methods for the ninth survey (pp. 1-18)
pdf version download![]() (864KB)
(864KB)